Radar and ocean sensors reveal new melt dynamics under Antarctica ice sheet that satellites missed
May 12th, 2025
Fast-moving ocean currents—not just warmer water—are driving the melt under the thick Fimbulisen ice shelf in East Antarctica, a new study shows.
Scientists including iC3 oceanographer Tore Hattermann made this discovery using rare year-round observations of melting at the boundary where ice meets ocean. Their study brings fresh insight into the physics of ice-ocean interaction and challenges how satellite data is used in sea-level rise projections.
.
Ocean speed, not just temperature, drives melting
Floating ice shelves like Fimbulisen act like stoppers, slowing the flow of land ice into the ocean. When they melt from below—a process known as basal melting—the pressure they exert weakens, increasing the chance of faster ice flow and sea-level rise.
Using a combination of surface radar and underwater moorings, the research team tracked melting under Fimbulisen over four years.
They found that melt rates varied from 0.4 to 3.5 metres per year, with short-lived peaks driven by rapid ocean currents under the ice. These bursts of turbulence enhanced heat transfer to the ice base, even when ocean temperatures stayed near freezing.
.
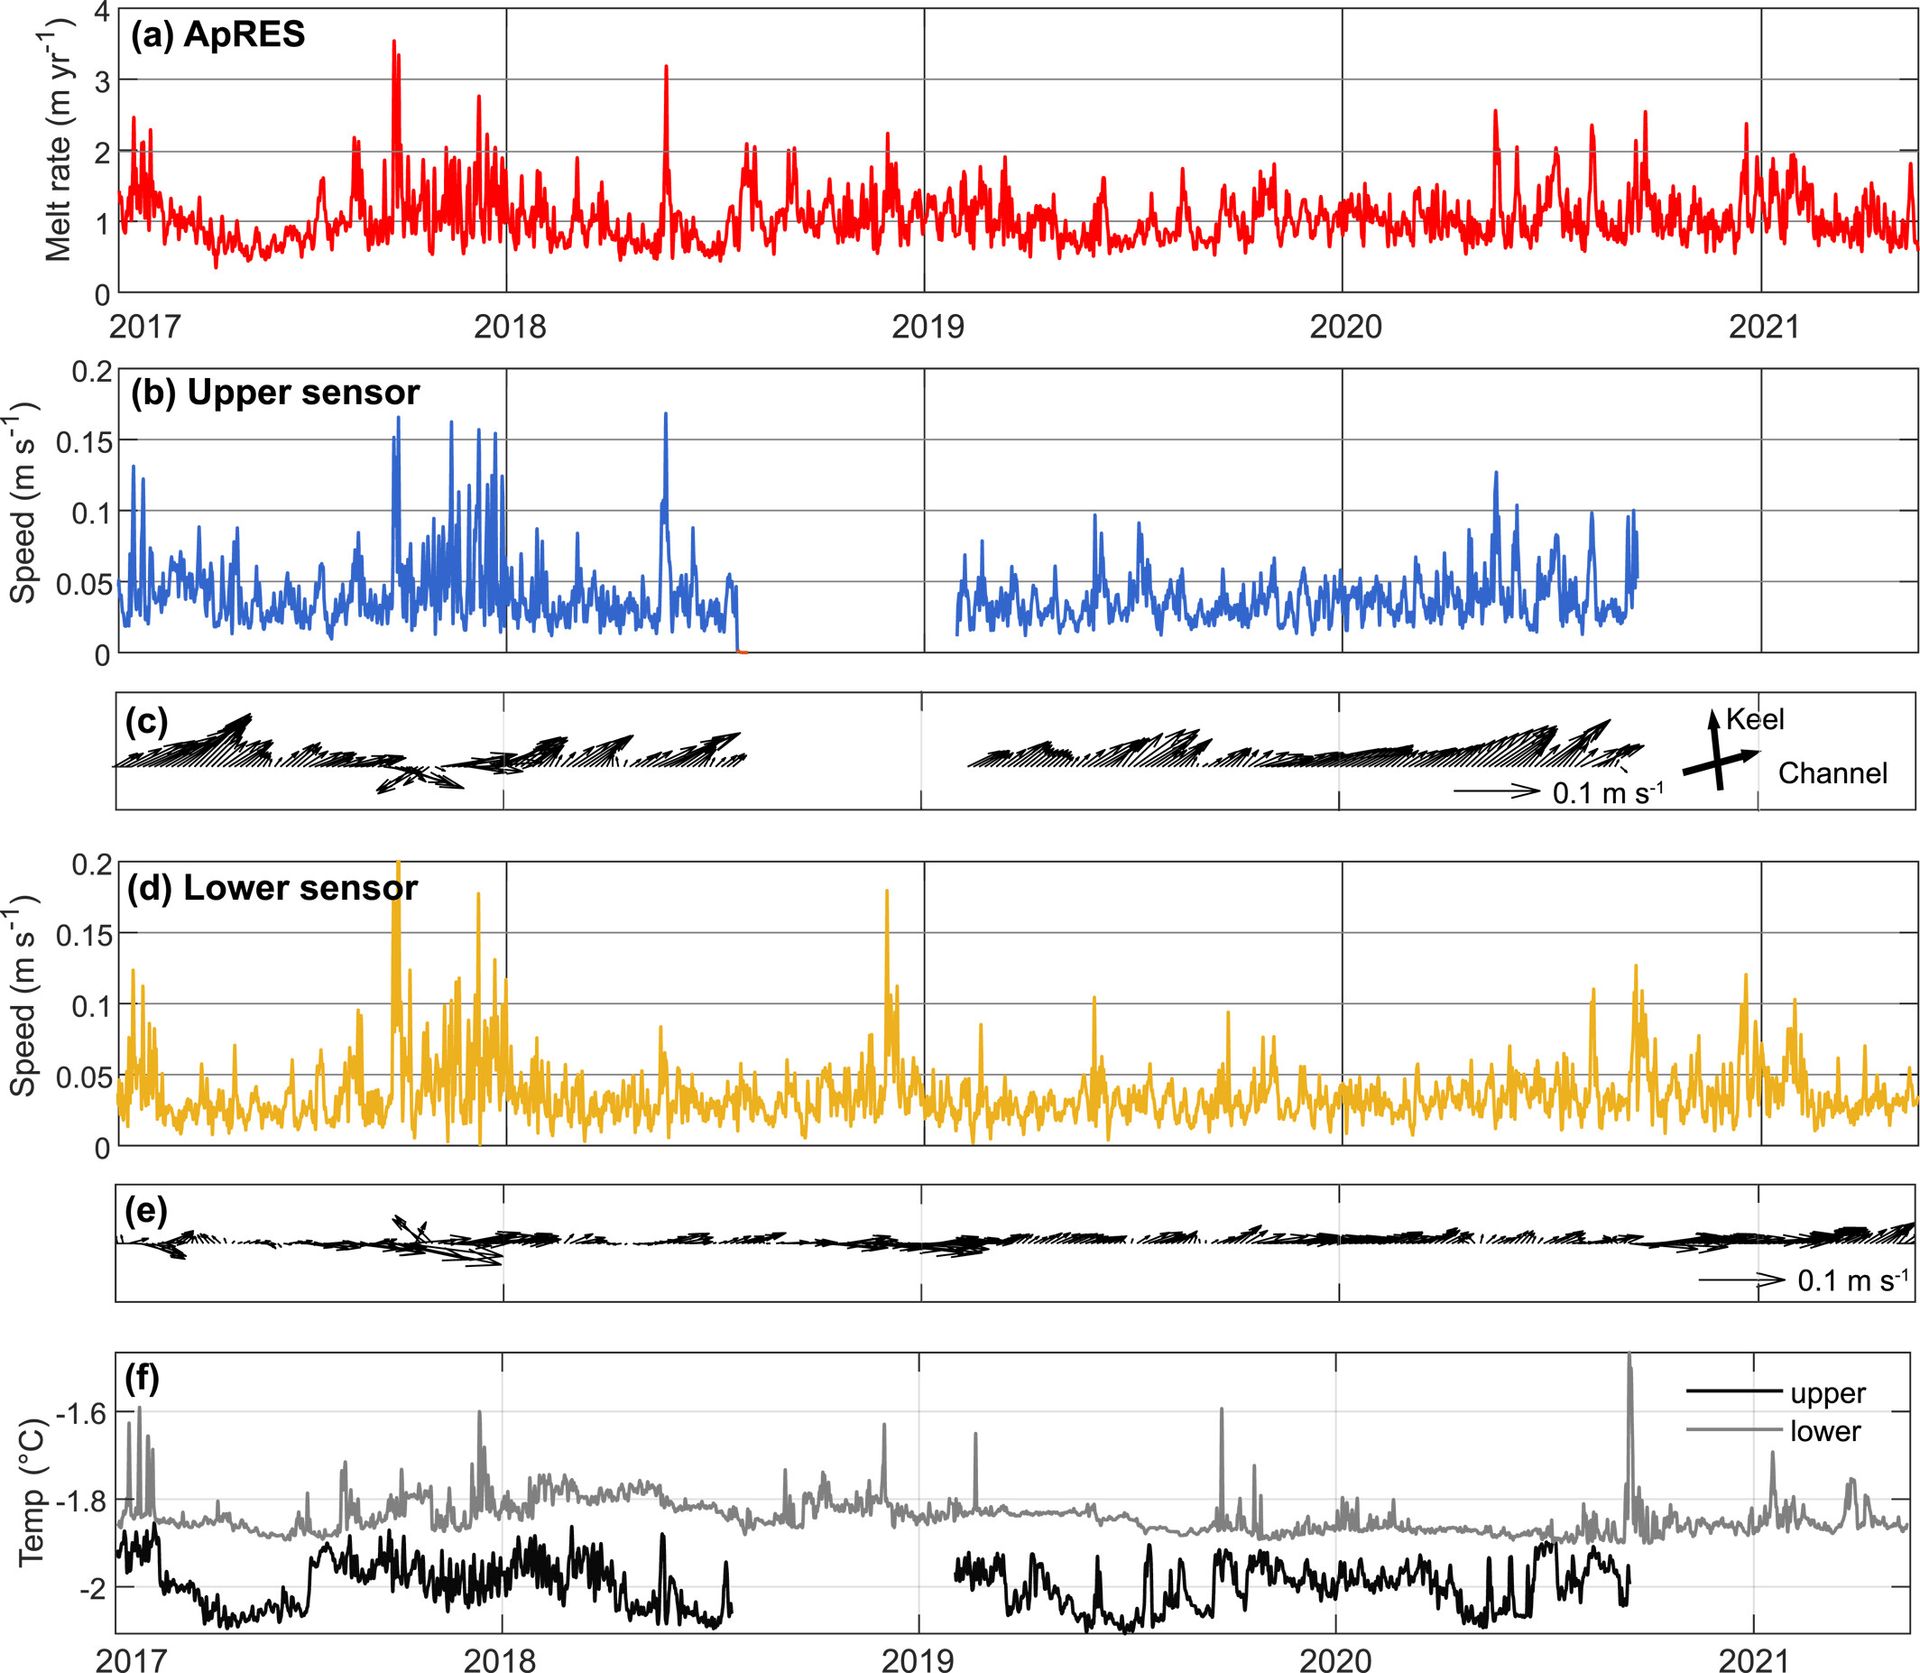
Figure: Basal melting and oceanic observations at the mooring site from January 2017 to May 2021. Credit: Journal of Geophysical Research: Oceans (in Lindbäck et al., 2025).
"Many models focus on ocean temperature," said Tore Hattermann, co-author of the study. "But what we saw is that fluctuations in ocean speed cause time variability of melting that is currently not very wellmeasured by satellites."
This discovery calls for a rethink of how basal melt is calculated in climate models. It suggests that ocean velocity data is just as critical as temperature for understanding where and when the Antarctic ice sheet is losing mass.
Implications for climate models and satellite data
The team used their radar and ocean measurements to test a widely-used parameterisation that predicts melt from current speed and thermal forcing. With this tool, they were able to reconstruct melt rates back to 2010, covering more than a decade of ocean records.
.
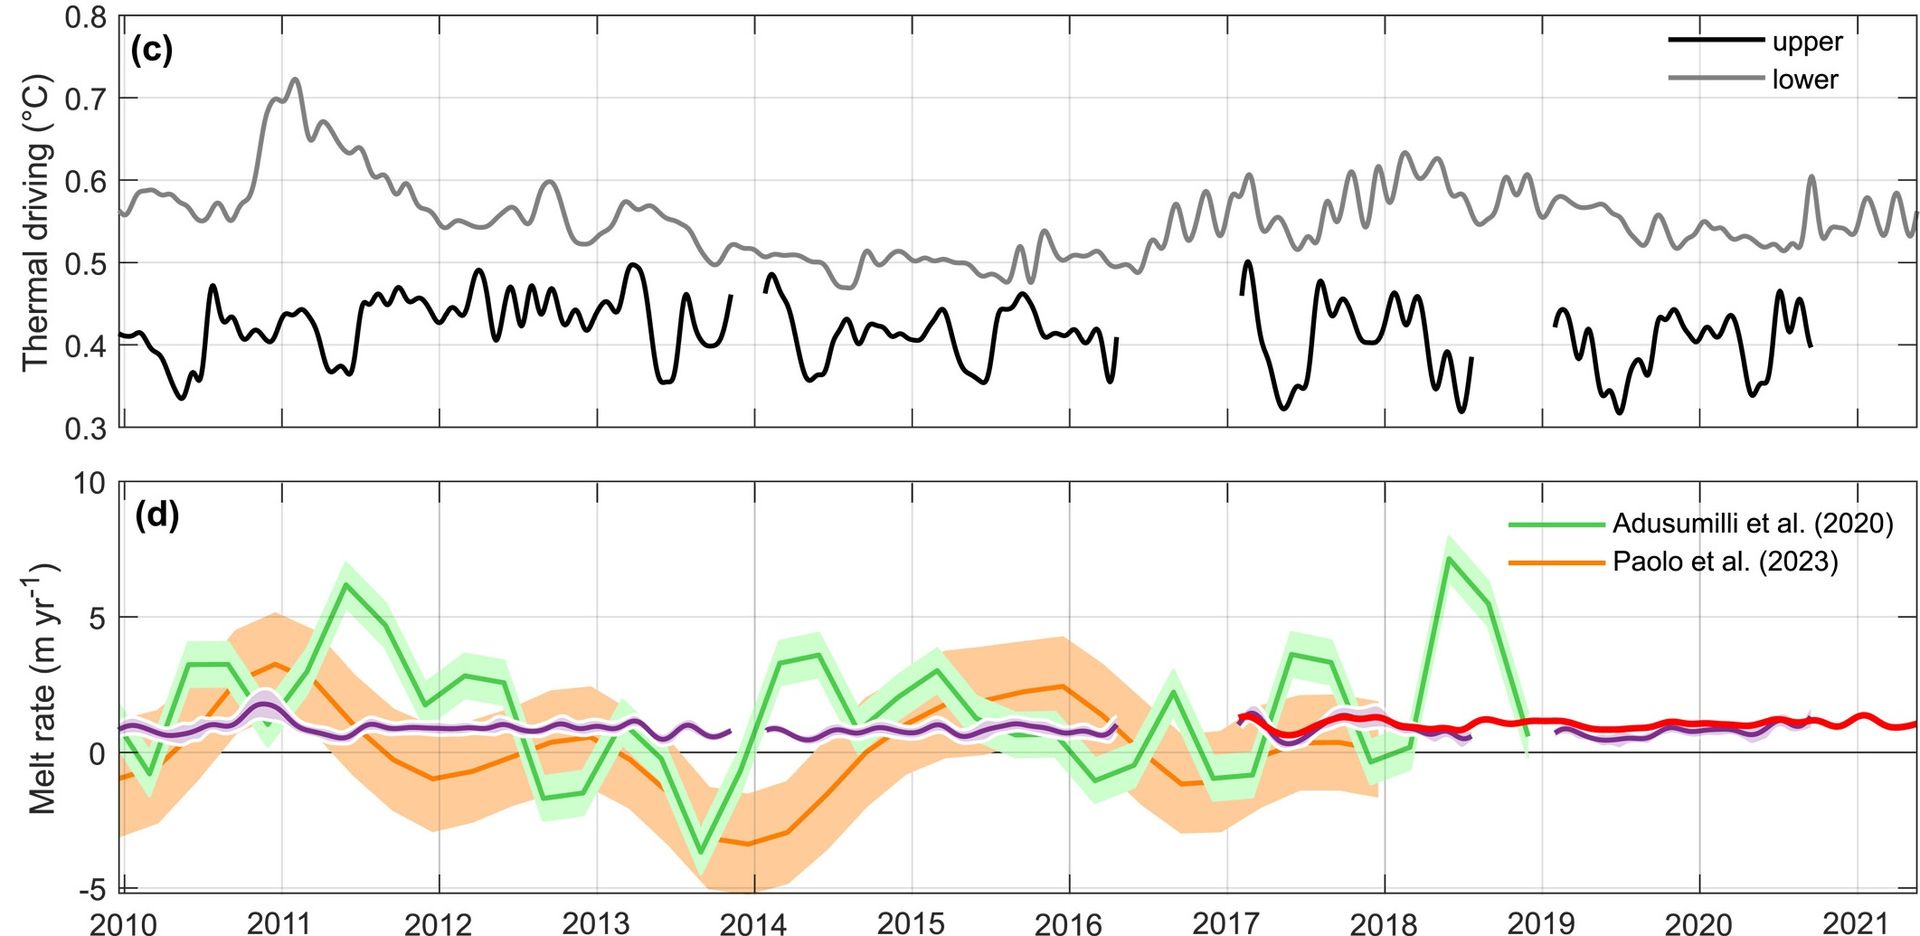
Figure: a) Melting rate parametrization compared to ApRES (sensors) observations and d) compared to melting rates from satellites. Credit: Journal of Geophysical Research: Oceans (in Lindbäck et al., 2025).
They then compared these results to satellite-based melt estimates. While the long-term averages agreed reasonably well, the seasonal variations did not. Satellite estimates showed melt rates swinging wildly from -3.7 to +7.1 metres per year. The radar measurements, by contrast, revealed a much narrower seasonal cycle, with peak melt in spring to autumn and a three-month delay compared to the satellite record.
.
This mismatch has big consequences. Climate models that rely on satellite data could be drawing incorrect conclusions about when and where Antarctic ice shelves are melting—and why. Overestimating melt in winter and underestimating it in summer could distort projections of future sea-level rise.
"In situ data like this is gold," said Tore. "It gives us the ground truth we need to validate satellite estimates and improve the models that guide climate policy."
.
A novel combination of techniques
To gather the data, the team installed an Autonomous phase-sensitive Radio Echo Sounder (ApRES) on the surface of Fimbulisen and drilled through 400 metres of ice to deploy ocean sensors underneath. The radar tracked changes in ice thickness with high precision. Meanwhile, the moorings recorded ocean temperature and current speed from just below the ice base to near the sea floor.
.
Next steps
The study highlights the value of long-term field observations in understanding how Antarctica is responding to climate change. It also shows the limits of satellite data when used without validation. More such observations are urgently needed, especially in remote regions of East Antarctica where data is scarce and climate models are uncertain.
"Models are only as good as the data that go into them," said Tore. "Our study shows how important it is to measure directly what’s happening under the ice."
.
The paper, Basal Melting and Oceanic Observations Beneath Central Fimbulisen, East Antarctica, is available open access in the Journal of Geophysical Research: Oceans.
Tore Hattermann is a researcher with the iC3 Polar Research Hub and the Norwegian Polar Institute (NPI)specializing in polar ice-ocean interactions. To learn more about his research, read this interview with him here.